Search the Community
Showing results for tags 'map'.
Found 7 results
-
I am making a free topo tool that makes use of Mapsui maps ( https://github.com/Mapsui/Mapsui ) that reads and manipulates shape and KMZ files and then inserts them in model space already projected. The problem is that it doesn't show the map inside the window, I don't know if I have to do it asynchronous, with threads or I need to give it permission for external connections. I had already been able to display Arcgis Runtime maps but they were only displayed in AutoCAD 2020 and 2021, so I decided to use MapSui but the result was worse. I am using the Autoloader (.bundle) structure to run the command, in that same folder I put all the necessary files for the map to work, but still it doesn't do it, it doesn't even give error. Does anyone know why this happens? or do you have any alternative for the map, it should be noted that I do not want to use the map that brings autocad because it is only available in the 2015 version onwards and I need it from 2013 and its projection systems are limited to UTM. Technologies: C# WPF Visual studio 2019 Autocad dll base 2013 Mapsui If you want me to pass you the project or .bundle folder, please comment
-
Hello, I have a city map with lots of building plans, most of them are 3D polylines and all of them has different Z values, according to their heights. I want to make a 3D model out of it by simply extruding them. But those 3D polylines have vertexes on different elevations. Is there a way to find a geometric center for each of those 3D polylines and flatten them into 2D polylines that has the Z value of that geometric center. So that I would have 2D polylines with different Z values. (I don't want to flatten everything to Z=0) Thanks in advance!
-
Hello, I am trying to find a way to view the geolocation map as grayscale within the active drawing. Can anyone assist? Thanks, Phil
-

How to create various scale output of a given image file
coralflame posted a topic in AutoCAD Drawing Management & Output
Hi! I have a 1:50000 jpeg image of a sample map and I wanted to create output images of 1:25000, 1:12500, 1:10000 and 1:5000. How can I do that without sacrificing the quality of the original file? Thank you in advance. -
Newbie here with a question. I have just begun to explore autocad 3d 2008. I have been through the tutorials and have watched everything on you tube I could find. Therefore, I barely know anything about autocad. My question is, can I upload a map of the county/parish I live in then draw its boundaries? I would then like to layer the gps coordinates of objects that were found throughout the parish? I am studying the distribution of a certain plants in a couple of counties. As I locate one and mark the gps coordinates, I would like to upload it to a map where people can look at the map and see where I have collected plants. Can anyone give me details on how to do this and, if you have time, why I need to do it the way you suggest. I am not yet familiar with the autocad jargon so please be gentle. Thanks in advance.
-
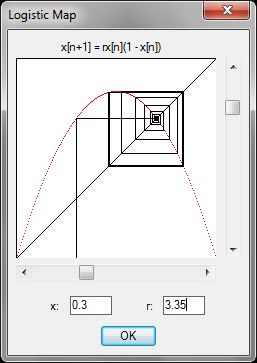
As many of you will know, I am currently studying for a degree in Mathematics, and, as part of the course, we study the dynamics of such functions as the Logistic Map. I've always been fascinated by this ostensibly simple map, which produces astoundingly complex dynamics resulting in chaos if a single parameter is varied. Quick Overview of the Logistic Map The Logistic map was originally devised as a population model, to measure the growth of a population, noting that the rate of reproduction of a species is proportional to the existing population and restricted by the available resources and competition for such resoures. We are iterating the difference equation: x[n+1] = rx[n](1-x[n]) For varying values of 0 Function maximum occurs at r/4, hence for 0 For 0 For 1 As r approaches 3, convergence to the fixed point x=r-1/r becomes increasingly slow, and a periodic point of period 2 appears when 3 From here we have a period-doubling cascade with the period doubling at a rate of approximately 4.669 (the Feigenbaum Constant). For r > 3.57 chaos emerges, with 'islands of stability' for various values of r at which periods of order 5,6,7 emerge. For r=4 the interval [0,1] is mapped to a set resembling a Cantor Set, with Hausdorff Dimension of about 0.538. A Visual Study of the Logistic Map To view the general dynamics of the Logistic Map, I have created a program where the parameter 'r' and the initial state 'x' can be varied, and the long-term behaviour of the model is displayed. To run the program: Download the attached Logistic.lsp and Logistic.dcl files. Ensure the Logistic.dcl file is located in an AutoCAD Support Path. Load the Logistic.lsp like any other LISP program (for instructions on how to do this, see here). Run the program by typing 'Logistic' at the AutoCAD command-line. I hope that I have sparked some interest in this area of mathematics and look forward to discussing the subject with the community. Enjoy! Lee logistic.lsp logistic.dcl

-

Creating a surface or solid from a Contour Map?
Sian posted a topic in AutoCAD 3D Modelling & Rendering
Hi, I have a contour map in polylines in the correct elevation and I was wondering how I can make it into a surface? I have read many threads and searched the AutoCAD Architecture 2010 user documentation but cannot find a "drape" command which everyone seems to suggest from other peoples posts. The map is quite detailed therefore the Edgesurf, Rulesurf etc won't work or I can't seem to get it to work! Any help would be very grateful! Thank you, Sian