Search the Community
Showing results for tags 'plot'.
-
I'm doing some floor plans in autocad and need to export them to illustrator or photoshop, but whatever I do, however I plot in autocad, the image always looses quality...the lines get thicker, I can't even see the dashed and dotted lines. I've tried exporting to EPS, dwg, pdf, but I keep getting the same result. I'm new to autocad and I don't know if this information is useful but I'll write it anyway...I'm drawing a floor plan which is 35mX6,5m big. I will be printing a layout of all my floor plans, sections ect. in 1:100 scale on a panel which is 1,9mX98cm. Can anyone please give me some advice on how to do this properly? Thank you
-
I'm be battling this all day and can't work it out. I've got a drawing and title block and a table with text on my model space. When i create viewports etc and try and sort out the layout, the text in the title block and key disappears. I'm probbaly doing something very basic wrong! Any ideas?
-

Plot current layout without entering name is lisp plot string
hosannabizarre posted a topic in AutoLISP, Visual LISP & DCL
I want to plot one particular layout in a drawing with multiple layouts. I want to set up a string of commands, using lisp, to print out the current/ open layout. Here is the current string I'm using: (defun c:plot40_B1 nil (vl-load-com) (command "_.-plot" "yes" "" "\\\\Kwifs1\\KWIN_40" "B1" "Millimeters" "LANDSCAPE" "NO" "Extents" "FIT" "CENTER" "YES" "KWIN39_BW.ctb" "YES" "W" "NO" "NO" "yes" ) (princ) ) This does not work - here is the F2 echo of the commands as they are processed by AutoCAD: plot40_KWIN39_BW _.-plot Detailed plot configuration? [Yes/No] <No>: yes Enter a layout name or [?] <K-17831>: Enter an output device name or [?] [url="file://kwifs1/KWIN_40"]\\KWIFS1\KWIN_40[/url]>: [url="file://kwifs1/KWIN_40"]\\Kwifs1\KWIN_40[/url] Enter paper size or [?] <A3>: A3 Enter paper units [inches/Millimeters] <Millimeters>: Millimeters Enter drawing orientation [Portrait/Landscape] <Landscape>: LANDSCAPE Plot upside down? [Yes/No] <No>: NO Enter plot area [Display/Extents/Layout/View/Window] <Extents>: Extents Enter plot scale (Plotted Millimeters=Drawing Units) or [Fit] <Fit>: FIT Enter plot offset (x,y) or [Center] <Center>: CENTER Plot with plot styles? [Yes/No] <Yes>: YES Enter plot style table name or [?] (enter . for none) <KWIN39_BW.ctb>: KWIN39_BW.ctb Plot with lineweights? [Yes/No] <Yes>: YES Scale lineweights with plot scale? [Yes/No] <Yes>: W The problem is this question: Enter a layout name or [?] : Currently the bit of the lisp that goes against that question is "". I have tried "Current" and "Layout", as I just want it to print the layout I have open, without entering a particular layout name, as this is obviously a print routine I want to use over and over again. Not sure what the > part of "Enter a layout name or [?] :" is. I am not sure what a valid answer is to "print current layout". I tried to turn off dialog boxes so I could find out what my options are at the command prompt, but can't figure this out. The old CmdDia = 0 doesn't work. Would greatly appreciate some advice!!! -
Hi everyone, I've been trying to edit the way some of our jobs print, we need them in black and white, with the exception of 4 colours. Using the plot styles manager I have managed to do this by turning all other colours to grayscale, while keeping the colours we want to print in colour assigned to their object colour. HOWEVER, when we printed it like this, our company logo on the paper space also printed in black (this made it come out as think black box on the page) The logo is made up of the following colours: 134,148,175 101,121,154 46,91,130 205,205,205 I tried to add these colours as individual styles in the "plot style table editor" however the buttons for "add style" and "delete style" are blanked out so cannot use them. I just wondered why this is, and if anyone can help me add these colours? The only way around it I've found so far is to change the colour of one of the 'standard' colours to the specific colours above: e.g; Change colour 2 in the Plot Style Table Editor, to have a colour of 134,148,175 and then turn the grayscaling off for that plot style. Although then if I have a layer with this colour assigned, they all print the wrong colour! Hoping someone could help me out here! Thanks a lot Rob
-
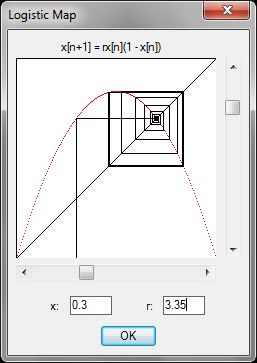
As many of you will know, I am currently studying for a degree in Mathematics, and, as part of the course, we study the dynamics of such functions as the Logistic Map. I've always been fascinated by this ostensibly simple map, which produces astoundingly complex dynamics resulting in chaos if a single parameter is varied. Quick Overview of the Logistic Map The Logistic map was originally devised as a population model, to measure the growth of a population, noting that the rate of reproduction of a species is proportional to the existing population and restricted by the available resources and competition for such resoures. We are iterating the difference equation: x[n+1] = rx[n](1-x[n]) For varying values of 0 Function maximum occurs at r/4, hence for 0 For 0 For 1 As r approaches 3, convergence to the fixed point x=r-1/r becomes increasingly slow, and a periodic point of period 2 appears when 3 From here we have a period-doubling cascade with the period doubling at a rate of approximately 4.669 (the Feigenbaum Constant). For r > 3.57 chaos emerges, with 'islands of stability' for various values of r at which periods of order 5,6,7 emerge. For r=4 the interval [0,1] is mapped to a set resembling a Cantor Set, with Hausdorff Dimension of about 0.538. A Visual Study of the Logistic Map To view the general dynamics of the Logistic Map, I have created a program where the parameter 'r' and the initial state 'x' can be varied, and the long-term behaviour of the model is displayed. To run the program: Download the attached Logistic.lsp and Logistic.dcl files. Ensure the Logistic.dcl file is located in an AutoCAD Support Path. Load the Logistic.lsp like any other LISP program (for instructions on how to do this, see here). Run the program by typing 'Logistic' at the AutoCAD command-line. I hope that I have sparked some interest in this area of mathematics and look forward to discussing the subject with the community. Enjoy! Lee logistic.lsp logistic.dcl

-
how can i plot my .dwg to pdf when under the plot/printing drop down there is no 'dwg to pdf' option? if used to be there before. thanks in advance.
-

Printer is plotting off scale (I am NOT using "fit to print")
crickettester52 posted a topic in AutoCAD Drawing Management & Output
I just bought an HP 11x17 printer for my desk... I'm having several issues with plotting from paperspace - whats on my screen is not pritning out to scale 1- If I dimension my title block in CAD it measures to 16 3/16" wide but when I print it out it equals 16 7/16 2- I put my viewport scale to be 1/4"=1'-0" and when I go to plot I do NOT choose the "fit to print" but rather the default which is 1"=1'. I have tried both printing in extents and window and they are both offscale. I prefer the paperspace to plot from extents (I've looked for things in my paper space that would be outside my title block besides my corner notches which are in the 'defpoints' layer that would throw it off and theres nothing. Please help me with this headache! I've been working on CAD for 5 years and have never had this problem. Why isn't it printing to scale? Am I making my title block the wrong size? It is xref'd in from a different dwg but it drawn to 1'=1' in that drawing - Id be happy to send whomever the dwgs too... Also I have found this: If I print with borderless print settings I have less title block being cut off... BUT I changed that in the control panel>printers properties for that specific printer but it does not carry through when I go to plot from CAD... so I set up a temporary file (went into print pref from inside CAD) and it was fine (as in it fit the whole title block but still off scale juuust a little) but I don't want to have to go to print pref every single time I print... and besides that, its still off scale a little Help! -
I am a student using AutoCAD 2010 to create drawings. Unfortunately, when I attempt to print, the template I was provided does not fit onto one page. I have reopened the template as a blank drawing and attempted to plot the template to determine if I had messed up the scale of the drawing. It is not the scale. The blank template at 1:1 still extends to a second page. Is there any way that I can continue to use this template without messing up the scaling of my drawing? Thank you very much for any suggestions.
-

Plot problem - a COPY of raster seems to jump to front during plot, then disappears?!
Tallguy posted a topic in Map 3D
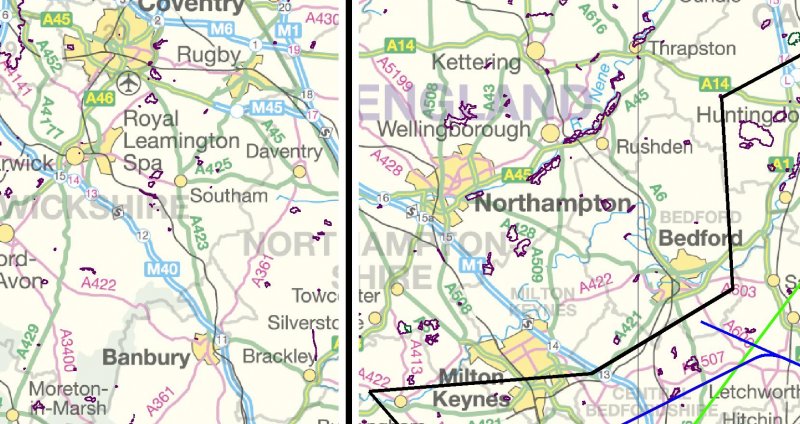
Hi CADTutors, this is an odd one. I'm plotting polylines, SHP data and a background raster. Until yesterday, all was well. Today, odd things are a-happenin'. This is a screenshot of the sort of thing I want to plot: The purple areas are CONNECTED and STYLED (in Display Manager) shp data, the black/white/blue/green lines are polylines, the raster background (GB Ordnance Survey Miniscale tile) is STYLED in Display Manager as Raster>>>33pc fade. When I plot to jpg, I get the same selected area of print, but just the OS tile UNfaded and nothing else. When I plot to PDF, and i open the PDF, I can watch the PDF "build" itself and the correct data is there (as per the screenshot) BUT it then gets "covered up" by the OS tile, unfaded. From this, I surmise that it's plotting everything correctly BUT then putting a copy of the UNfaded Raster tile ON TOP of everything, obscuring it. . I only know this 'cos the PDF build-up shows me what it's doing. It didn't do this until yesterday, and this has happened before but "it just sort of came back". I tried the following today, no luck: All the various "send to back" options for the raster >> wouldn't explain the un-fading. WBLOCK out the polyline data, create a new DWG, INSERT block, re-import the raster and re-connect and STYLE the SHP file. Restart my machine and do all of the above. Restart my machine and not run any other applications (Outlook, Internet Explorer etc). Hit the monitor with a binder until it bleeds liquid crystal, and otherwise act like a child having a tantrum . That was satisfying but ultimately unproductiveo:). What's most annoying, apart from all the annoying stuff, is I can see it's gonna happen. During the plot process (I love watching a little progress bar fill up from left to right), I see my display turn white, then this un-faded raster fills the screen, plot completes, the un-faded raster disappears and leaves my screen as per the screenshot. I check the plot and hey presto! it's screwed. In effect, I think it's laughing at me. Dear, dear AutoCADists, please could you help? Or, failing that, could you just send me money to soothe me? Pounds Sterling is fine, as is U$D or €Euros...
-

viewports wont print to correct scale
abell8418 posted a topic in AutoCAD Bugs, Error Messages & Quirks
My viewports wont print to the correct scale. I measure it out in paper space, and all the linework measure perfect, however, when i plot it off, its off by maybe 5 or 10 percent. This hasnt happened in other drawings. I've checked plans for other jobs. Also, i have run audit, but to no avail. I just tried copying some stuff into another drawing, but it still plots funny. i've tried to plot a portion on our smaller printer, but it still prints off. only this time, the other way, its 5 to 10% too big. has anybody ever had this problem???? Thank you so i checked more into it, and it looks like the vertical scale of the drawings is ok, but the horizontal scale is off literally 3 or 4 percent. not a whole lot i know, but still, what could cause this? can inkjet plotters be off by this much? its on a d size sheet. -

Missing detail when on Physical plot from ACAD 2011 generated PDF
MrButtonmush posted a topic in Design Software
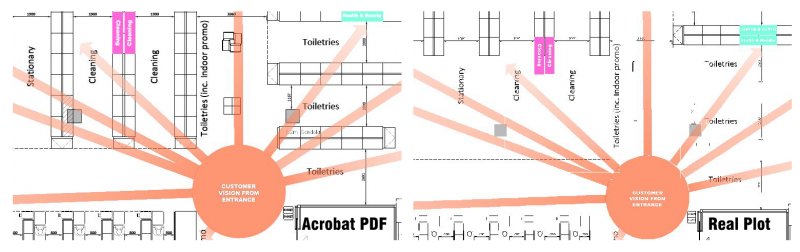
I have created PDF plots of some AutoCAD 2011 plans that have layers in them and this have been carried over to the PDF which is great. When I open these in Acrobat 9 Standard they look perfect and I can turn layers on and off as I Choose which is also great. When I plot the PDF's from a REAL printer (in this case ix4000) the plot generation preview and subsequent plot has missing chunks of data where another layer passes above. The items in question that are doing the "blocking" are gradient fills with transparency. Attached is a copy of what the PDF looks like in Acrobat vs. the Physical Output. WHY !!?!?
-
i dont know if iam being thick?!!? i have done my drawing at 1:1 in model space created my layout and plot scale set it to scale i want to create the print at but when printed the scale factor doesnt affect the printed drawing only the ammount that is printed on the paper!
-
I'm using Autocad Architecture 2010 and I've created a drawing with layers (each in a different colour) and now I want to print it with black lines displaying the line weights. I've been searching online and read about ctb and stb... and I AM VERY CONFUSED! Please can someone explain to me in basic terms how I can print my drawing in b&w? Thanks so much.
-

Plot multiple layers via script
pharrold posted a topic in The CUI, Hatches, Linetypes, Scripts & Macros
Hi, I have a script that will plot layers automatically without me going into layer manager and changing them and then clicking plot. The drawings i will be working with are electrical, they have many layers in one drawing. the layers are not sequentially numbered so makes the script harder to produce. In theory i wanted a vB program were i have check boxes of the layeers and then the layers checked are pasted into the script. Has anyone got any ideas? the script is as follows: