Search the Community
Showing results for tags 'plot'.
-

Named plot styles do not have effect neither on screen nor on plot output
chgeiselmann posted a topic in AutoCAD Drawing Management & Output
I am trying to use named plot styles (set in my home-made .stp file) to manage the print output of my layouts. (The basic idea is to print all objects from all layers, what ever layer colour they have, in black; additionally I would like to play with lineweights, and I consider named plot styles to be the best solution for this.) The problem is: my named plot styles do not have any effect what so ever on the plot output. They also do not have effect on the screen output, although in the page setup the tickmark "Display plot styles" is set. Two interesting observations in addition: 1) Used on the model (as opposed to the paper layout viewports), the named plot styles do have effect. I.e. my objects are represented black, and with different lineweights, as long as "Display plot styles" is tickmarked. After un-ticking it, the model shows coloured lines as expected, and vice versa. 2) On the paper layout viewport, I do not get any visible difference from applying the named plot styles (as I said above), with one interesting exception: Used on the frame that comes with the viewport on the paper layout, the named plot styles have effect. E.g. when I set the colour of the respective named plot style to green and assign this plot style to the layer where the frame sits, the frame gets green. However, nothing happens when I do this with the layers where my ordinary objects (polylines) sit. I have spent now an entire 8 hours experimenting, searching in fora, etc. - to no result. I am using Autocad Architecture 2015. I started my project with the default settings, which was to use .ctb (colour plot styles) rather than .stb (named plot styles). I then changed this by using CONVERTCTP and CONVERTPSTYLES; from the resulting .stp-file, I deleted the colour mapping table in order be able to add more styles (as this is not possible when the colour mapping table is included.) Any ideas how to solve the issue? Am i doing something wrong? Or is it a bug, and could be solved by using Autocad Architecture 2016? -

Draw a Lot using Coordinates from Google Earth
Subiran posted a topic in AutoCAD 2D Drafting, Object Properties & Interface
Hi. I'm a beginner in CAD, I'm going to ask how to draft a lot using the coordinates(latitude and longitude) from google earth. Example: Point A. Latitude: 11 Degree 18'2.22"N Longitude: 124 Degree 57'46.89"E Please check my attachment picture. -
Hi to everyone!... Someone knows a Lisp to plot a internal sheets of a model space file? Eg.: I have a dwg file with 10 sheets internal, I know how to put name at each sheet (NEWVIEW) and it appears at same place of Extend, Display or Window at plot configuration screen. If I put names as a numbers: 1, 2, 3,..., 10, it's possible to select one page or all to plot at the same time? Or create a Lisp that can help it!?... Thanks in advance!... Its possible using a comand: -plot Detailed plot configuration? [Yes/No] : y Enter a layout name or [?] : Enter an output device name or [?] : Canon iR2525 Enter paper size or [?] : Enter paper units [inches/Millimeters] : m Enter drawing orientation [Portrait/Landscape] : Plot upside down? [Yes/No] : Enter plot area [Display/Extents/Limits/View/Window] : v Enter view name : 3 (the view name) Enter plot scale (Plotted Millimeters=Drawing Units) or [Fit] : Enter plot offset (x,y) or : c Plot with plot styles? [Yes/No] : Enter plot style table name or [?] (enter . for none) : Plot with lineweights? [Yes/No] : Enter shade plot setting [As displayed/legacy Wireframe/legacy Hidden/Visual styles/Rendered] : Write the plot to a file [Yes/No] : Save changes to page setup [Yes/No]? Proceed with plot [Yes/No] :
-
Hello, I'm having a issue with pdfs plotted from CAD that are being used for Bluebeam software where the pdf is unusable. The file size is less that 1mb, I have unticked the box to include layer information in the plot pdf options, but the file is sluggish zooming in and out etc. Can anyone help with this problem? Cheers!
-

Could Greatly Use Some Help with Plotting Multiple Sheets At Once
MillerMG posted a topic in Civil 3D & LDD
Okay, so i feel very stupid for asking for help with this but to save my life I cannot figure this out. We have anywhere from 30-50 sheets for site plans. Opening each sheet and plotting them takes anywhere from 30 min. to an hour. This is taking up too much time when I should be drafting instead of hitting the open, plot, close buttons. Can someone please explain to me from start to finish of how to, I guess, set up sheet sets to plot the whole set of plans at once? I think a sheet set would be used. Not sure about that though. I would GREATLY appreciate any help. Thanks everyone. Miller -

A couple of Print Lisp Routines that might come in handy!!!
BrianTFC posted a topic in AutoLISP, Visual LISP & DCL
Here are a few Print Lisp that I've come up with help of a multitude of people on this website, I thought that I would share them for whoever would like to use them. Enjoy!!! ;;; Shop Prints 18x24 (defun c:Shop (/ ob ss bn mn mx) (vl-load-com) (pltnum) (if (and (progn (initget "B") (setq ob (entsel "\nSelect Block/B for blockname: ")) (cond ((eq ob "B") (setq bn (getstring "\nEtner Block Name: ")) ) ((and (eq (type ob) 'LIST) (vlax-method-applicable-p (vlax-ename->vla-object (car ob)) 'getboundingbox)) (setq bn (cdr (assoc 2 (entget (car ob)))))))) (tblsearch "BLOCK" bn) bn (setq ss (ssget "_X" (list '(0 . "INSERT")'(410 . "Model")(cons 2 bn)))) ) (progn (vla-zoomextents (vlax-get-acad-object)) (repeat (setq i (sslength ss)) (vla-getboundingbox (vlax-ename->vla-object (ssname ss (setq i (1- i)))) 'mn'mx) (repeat xplta (command "plot" "yes" "model" "Your Plotter Name.pc3" "18x24(ARCH C)" "inches" "LANDSCAPE" "no" "Window" (trans (vlax-safearray->list mn) 0 1) (trans (vlax-safearray->list mx) 0 1) "fit" "center" "yes" "Your.ctb" "yes" "no" "no" "yes" "yes") ) ) (princ "\nNo Blocks Selected: ") ) ) (defun pltnum () (setq numplt (getint "\nEnter Number of Plots <1>: ")) (if (= numplt nil) (setq xplt 1) (setq xplt numplt)) (if (<= xplt 15) (setq xplta xplt) (setq xplta 15)) ) (princ) ) ;;; LAYOUT PRINT 18x24 (defun c:Tab ( / CURRENTTAB) (pltnum) (setq CURRENTTAB (getvar "ctab")) (repeat xplta (foreach LAYOUT (layoutlist) (setvar "ctab" LAYOUT) (command "-plot" "yes" "" "Your Plotter Name.pc3" "18x24(ARCH C)" "Inches" "LANDSCAPE" "NO" ;PLOT UPSIDE DOWN "EXTENTS" "FIT" "center" "YES" ;PLOT WITH PLOTSYTLES "Your.CTB" "NO" ;PLOT WITH LINEWEIGHTS "NO" ;SCALE LINEWEIGHTS WITH PLOT SCALE "YES" ;PLOT PAPER SPACE LAST "NO" ;REMOVE HIDDEN LINES "NO" ;WRITE THE PLOT TO A FILE "NO" ;SAVE CHANGES TO LAYOUT "YES");PROCEED WITH PLOT ) ) (defun pltnum () (setq numplt (getint "\nEnter Number of Plots <1>: ")) (if (= numplt nil) (setq xplt 1) (setq xplt numplt)) (if (<= xplt 15) (setq xplta xplt) (setq xplta 15)) ) (setvar "ctab" CURRENTTAB) (princ) ) ;;; Printpage18 (defun c:prp18 (/ ss mn mx) (vl-load-com) (pltnum) (if (setq ss (ssget "_:S:E" '((0 . "INSERT,LWPOLYLINE")))) (progn (vla-getboundingbox (vlax-ename->vla-object (ssname ss 0)) 'mn'mx) (repeat xplta (command "plot" "yes" "model" "Your Plotter Name.pc3" "18x24(ARCH C)" "inches" "LANDSCAPE" "no" "Window" (trans (vlax-safearray->list mn) 0 1) (trans (vlax-safearray->list mx) 0 1) "fit" "center" "yes" "Your.ctb" "yes" "no" "no" "yes" "yes") ) ) ) ) (defun pltnum () (setq numplt (getint "\nEnter Number of Plots <1>: ")) (if (= numplt nil) (setq xplt 1) (setq xplt numplt)) (if (<= xplt 15) (setq xplta xplt) (setq xplta 15)) ) ;;; PDF's All Tabs to source drawing folder with Tab name. (defun c:pdf ( / *error* cm fd ) (defun *error* ( msg ) (if (= 'int (type cm)) (setvar 'cmdecho cm) ) (if (= 'int (type fd)) (setvar 'filedia fd) ) (if (not (wcmatch (strcase msg) "*BREAK,*CANCEL*,*EXIT*")) (princ (strcat "\nError: " msg)) ) (princ) ) (foreach layoutname (vl-remove "Model" (layoutlist)) (command "._layout" "set" layoutname) (progn (setq fd (getvar 'filedia) cm (getvar 'cmdecho) ) (setvar 'filedia 0) (setvar 'cmdecho 0) (command "-plot" "_Y" ;; Detailed plot configuration? [Yes/No]: "" ;; Enter a layout name <Current-Layout>: "dwg to PDF" ;; Enter an output device name: "ARCH expand C (18.00 x 24.00 Inches)" ;; Enter paper size: "_I" ;; Enter paper units [inches/Millimeters]: "_L" ;; Enter drawing orientation [Portrait/Landscape]: "_N" ;; Plot upside down? [Yes/No]: "_E" ;; Enter plot area [Display/Extents/Layout/View/Window]: "_F" ;; Enter plot scale (Plotted Inches=Drawing Units) or [Fit] <1=1>: "_C" ;; Enter plot offset (x,y) or [Center]: "_Y" ;; Plot with plot styles? [Yes/No]: "tfc.ctb" ;; Enter plot style table name (enter . for none): "_Y" ;; Plot with lineweights? [Yes/No]: "_N" ;; Scale lineweights with plot scale? [Yes/No]: "_N" ;; Plot paper space first? [Yes/No]: "_N" ;; Hide paperspace objects? [Yes/No]: (strcat ;; Enter file name: (getvar 'dwgprefix) (cadr (fnsplitl (getvar 'dwgname))) "-" (getvar 'ctab) ".pdf" ) "_N" ;; Save changes to page setup [Yes/No]: "_Y" ;; Proceed with plot [Yes/No]: ) (setvar 'cmdecho cm) (setvar 'filedia fd) ) (princ "\nCommand not available in Modelspace.") ) (princ) ) -
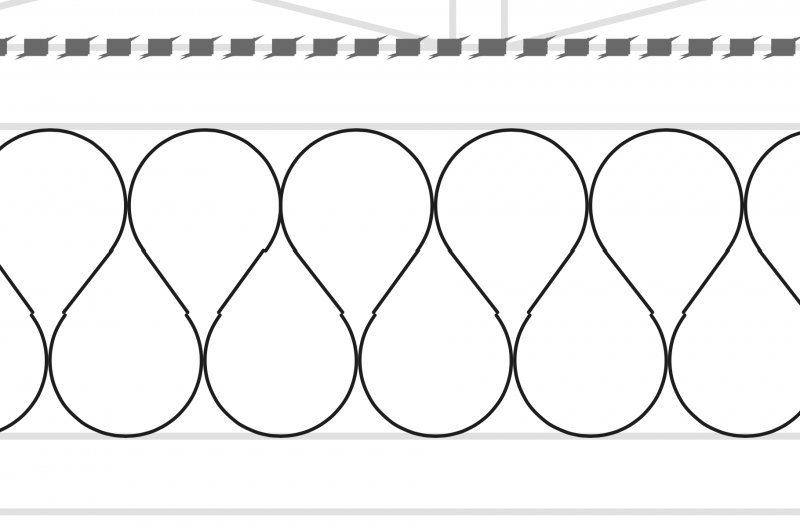
Hello, i am facing problem with plotting. I use Autocad 2015 on Mac. I have uninstalled Autocad and install it again. I have reseted all settings but keeps plotting Dashed lines and circles like that. I tried to save it as Pdf , i opened it on photoshop but it didn't work. Ty

-
Hello, I have been able to fix my hidden line prints by using the 'hideprecision' variable. I would like to do the same with the 'shades of gray' setting. I have a few mviews in a single layout tab and when I preview or plot the linework is all chopped up like it is at a very low res. Any and all help is appreciated. Thanks, Phil
-

How to Set drawing To a Layout and Print it
atulkumarengineer posted a topic in AutoCAD Drawing Management & Output
Hi! how to set out a drawing to a Layout from model space? Please explain step by step process. Atul -
Hello all and thank you in advance for help. I am familiar with AutoCAD and AutoCAD Mechanical, but I am new to Inventor. There are several detail files that I have had to go into and make changes. When I save, the plot command either pops up prompting me to plot or all the pages in the detail automatically plot. If I have my printer properties open, I can cancel this before it plots. Is there a way to turn this off in Inventor 2014?
-

How to plot viewport without LWT ?
cartographer posted a topic in AutoCAD Drawing Management & Output
I'm working on a drawing in AutoCAD 2007 , where final document will have several viewports - one of them should have no Line weight values. Any ideas guys ? -
Hello, I've drawn two autocad drawings. Everything is in meters and has the right distance (1meter in autocad is 1meter in real life.) The drawing is 2d. Now I need to make a PDF from this drawing. I need to do this by deleting all the layouts and after that right click at the layout and click at plot. I just dont see how I need to take the right scale. Whenever I use as plot area Window and press fit to paper it looks good, but if I enter a scale, the only outcome is 1:1 which is kinda weird because my drawing is about 10 meters long and I need to plot it to A3... How the heck can I make a good plot by chosing a scale that actually works and I can draw in my drawing? Thanks in advance, Chris.
-

2 drawings: 1 plot Truetype as text, other as vector
BrT posted a topic in AutoCAD Drawing Management & Output
Hi, I have a problem with printing (to PDF) Truetype fonts. I have 2 drawings with, visible, the same entities. When I plot 1 drawing text in the PDF is text, with the other drawing there are vectors in the output. The plot settings are identical (I use a script) and I did a full setvar comparison between the drawings and the settings are the same except the drawing specific- and some dim/chamfer/fillet settings. The history of the files is verry different: the one that works is made from a in-house template, created long time ago. The other was a, I think, AutoCAD 2010 drawing. I deleted proxy's in AutoCAD 2009 with exporttoautocad. Then deleted all content (delete all layouts and after that "erase all"), run purge, audit and saved as AutoCAD 2002. Then I used ExplodeProxy2000.arx. The file was 62kB where the other is 32kB so I wblocked the content to the file it is now and still not working. If I erase all content from 1 file, purge the file and copy the content from the other file the outcome is still the same. Xref 'TTF plot.dwg' in 'Vector plot.dwg' and the output is in vector, the other way around and all text outputs as text. Setup I'm using: Windows 7 Ult 64bit, AutoCAD 2002 and Acroplot for printing PDF's Anyone experienced the same problem and is the a solution? TTF plot.dwg Vector plot.dwg -
Hello all, I have been working on printing to text-searchable PDFs, and ran into a little problem. When I regen a drawing and print to PDF, the output is not consistent - it changes just a little bit from plot to plot. This is unacceptable to the client, who is very picky about their drawing packages. Can anyone reproduce this problem? I attached a script and a drawing that shows what I mean. I put both in C:\test\, then opened the drawing and loaded the script. The result is 10 pdfs saved in that folder, each one a little bit different. The right most line is sometimes outside the print area, sometimes inside. It seems completely random. The only code that runs between plots is (command "undo" "mark" "-purge" "all" "*" "no" "-overkill" "all" "" "done" "-purge" "all" "*" "no" "regen" "undo" "back") But how on earth could that change the drawing?! Furthermore, why does it change the drawing in a way that's inconsistent? If it was shifting things around, that's one thing, but to sometimes change things and sometimes leave them alone? I feel like my computer is non-deterministic example.dwg print.lsp
-

Xrefs in layout with excel object not plotting correctly
BakedPotato posted a topic in AutoCAD Drawing Management & Output
Hi, I have several drawings that each include (1) a layout containing a viewport showing drainage areas & an x-referenced survey and (2) a spreadsheet with drainage calculations. Recently a problem has developed such that the x-referenced survey is not plotting correctly on the layouts that contain the spreadsheet. At first I thought it was a fluke with one drawing, but then it started happening on all my drawings, even ones that had previously plotted fine. Here are the details: 1) The x-reference plots fine in all the layouts within the drawing except the one that contains the spreadsheet. 2) The spreadsheet is put into the drawing by selecting the cells in Excel, copying, going to paperspace in Autocad, and pasting the cells in. 3) I have two methods for creating pdfs in Civil 3D 2008. First method: go to the "Adobe PDF" menu and select the "Convert to Adobe PDF" option. This method plots everything fine except the xreference. Second method: Go to "File" -> "Plot" and use the plotter "DWG to PDF.pc3". This method plots the xreference, but the text in the titleblock and the spreadsheet is all garbled and fuzzy. Any suggestions? Is there some system variable or AutoCAD setting that would cause this? -
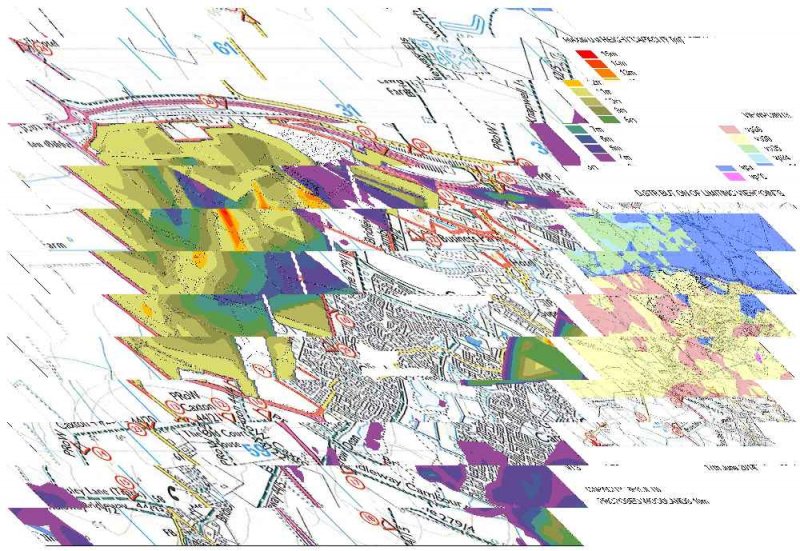
If I select certain images sizes I get a corrupted jpeg plot - see attached. The image size plotted was originally 7027 x 4842 pixels = A2; reducing this to 4825 x 3039 worked fine. I suspect it may be something to do with my graphics card (AMD Radeon R9 270) as I have experienced similar with other software too, where the rendered image size was 4606 x 4606 pixels, and I had to render 4611 x 4611 then resize them in Photoshop back to 4606 x 4606). Display drivers are up to date. Any ideas much appreciated, thanks
-
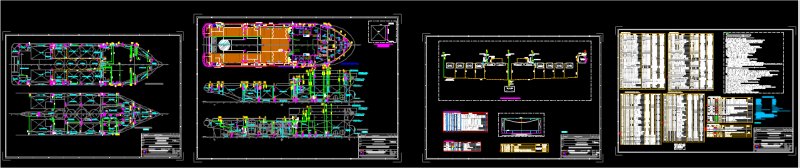
Hi, Guys i have 4 views in a drawing, (view the screen shot below) i have to plot these 4 views into a pdf document, (each view into a seperate page in the PDF ) now imagine me doing this for 40+ drawings files, in which each of the drawing file also has 4 or more views (this process is really frusturating ) I know about the layout setting method,(Setting up layouts for 40x4views is hard ) I tried a work around of plotting the full view of the 4 documents into A0 PDF, and then cropping and splitting the PDF pages, (This is also hard ) any ideas, methods or software recommendations are appreciated,
-
I have AutoCAD 2014 on a Mac. I DO NOT have Options under tools, so I cannot change my plot style to appear when I print. I have created a plot style with lineweights, but when I go to print, I do not get the dialog box with all my choices, just a regular "print" information, soi my lineweights, plot style, etc are not shows... I remember decades ago I had a similar problem, I had to make the machine believe I had a plotter... how do I do that? Do I need to upload something? Please help... Thank you!
-
My company just switched over to AutoCAD 2014 and for some reason the PUBLISH command is not working, or following through with the printing once we complete the required steps to plot. We are able to select the drawings to be plotted (8"x11" sheets), then successfully bring in our page setup that we created with one of the drawings to be plotted (which we use the same template with the same limits on ALL of our 'drawing templates' we design with. After we hit the PUBLISH button at the bottom it goes into the background and just stays there with no errors or anything After a little while we end up just having to cancel and plot individually. We used TrueView to BatchPlot which is identical to the batchplot(publishing) in ACAD 2014 WITH NO ISSUES! Can someone help me as to why I would possibly be having this hiccup?
-

Batch plotting PDF Autocad 2014! HELP!
tmelancon posted a topic in AutoCAD Drawing Management & Output
I am working with Autocad 2014 and am trying to batch PDF using the BATCHPLOT utility built in to autocad. The problem I have is for some odd reason it is trimming off the right margin. It does not let me define how I want to window or anything to be plotted and I need to plot over 600 dwg to pdf. I used a page setup one time but had to hit ENTER all morning! Please help and chime in! God bless! -
I'm looking to save some time (aren't we all). We draw in many different colors to help our, sometimes, complicated dwgs easier to work with and differentiate between things. But our end product is a black and white drawing. Is there a lisp out there for toggling to white background and all black everything else? I can plot a dwg, wait for it to load, open it, review and then make changes and repeat as necessary. Or, ideally, I can hit one button, review and make changes on the fly before the plotting process. Plot previews are also a bit cumbersome. I hate to post this, as it is most likely out there but the search function with this forum can be a bit shaky. Any help would be appreciated. Thanks, -Nobull
-
I am currently using AutoCad 2005 and having trouble plotting. Every time I plot with different drawings I have to figure out new X and Y values in order to have the plot centered (close to centered). The other two computers/users in the office don't have this problem. I can't click on "center the plot" because the boss needs the drawing slightly shifted. The other users have set permanent X and Y vales for their plots and seem to have no problems and this is not the case with my station. Also, the plot preview shows the drawing exactly where I want it but it never prints accordingly. Any ideas? Thanks
-

Batch Plot to PDF with Custom Filenames
churchill posted a topic in AutoCAD Drawing Management & Output
Here's a question for the jedi's. Any idea how I can do a batch plot to PDF whilst appending some element to the end of the filename? Using AutoCAD 2011's batch plot, or TrueView 2014's batch plot the default PDF filename when plotting to PDF appears to be: -.pdf Which is okay. But I want to append to that the revision of the layout (C1, C2, etc.) which I currently store in a title block as a block attribute value. Any ideas if there's a method for somehow pulling this out and including it after the filename such that I could end up with: --.pdf Any thoughts? We're currently trying to transition to using the Sheet Set Manager, is the above any easier to achieve using that? TIA. -
When i try and plot my 3D model in the Hidden style, so it simply looks like a black line drawing the plot comes out weird. The plot for some reason adds a thick black line around my entire plot, and makes all the other lightweights look faded out. How can i fix this??primary bar 3-Layout2.pdf
-
Hi everyone! I just want to start by thanking you all, as most of the times I have an issue this forum is a great resource in which I find many answers without having to create a thread Since we use Acad 2014, some of my coworkers have started using viewbase style views. Since we have standards regarding lineweights, I've tried to find in vain a way to set the lineweight default values for the viewbase layers (MD_Annotation, MD_Hatching...) when CAD create them. Since i couldn't find any way to give them default values upon creation, my only option was to pre created on our templates all the layers generated by viewbase. The thing is that when someone purge a drawing prior to create the first viewbase, (which is 95% of the cases - designers make the design/3d model, purge, then the draftsman takes over the project to make the fab plans) the MD_ layers get deleted, and when they are generated again all the lineweights don't match our standards. From my perspective, I now have 2 options. 1- Beat the hell out of the designers whenever they purge the layers (which is not very nice..) 2- find a workaround (which I did, but I would need some help to achieve my goal since I'm not really acquainted with reactors) basically what I need is a reactor (in acaddoc.lsp i'd guess?) doing that: reactor@plot: verify if layers (MD_Annotation, MD_Hatching, MD_Hidden, MD_Visible) exist if not: resume plot if they do exist: check lineweight setting to ensure they match our standards (MD_visible = default, MD_hatching = .05mm, MD_hidden = .13mm, annotation=default) if true: plot if not: change values then plot If the MD_ layers do exist, i'm not sure if I should bother looking at their lineweight value to compare them with our standard, to change their value if they dont, or if I should directly set their lineweight value if the layers exist. Thanks in advance for your help Cheers, Jef!